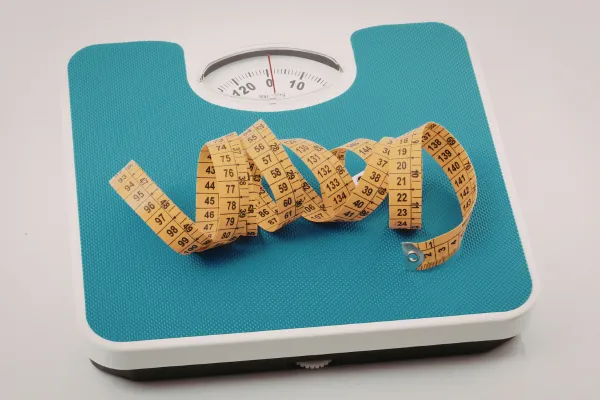
Tracking Progress: Beyond the Scale
You step on the scale. The number is the same as last week. Or worse—it's up two pounds despite eating in a deficit and training hard. You're discouraged. You feel like a failure. You consider quitting because "nothing's working."
Meanwhile, your clothes fit better. Your lifts are going up. You have more energy. People are complimenting your appearance. You look visibly leaner in the mirror. But none of that matters because the scale didn't move.
Here's what you're missing: the scale is one metric, and often a terrible one. It can't distinguish between fat, muscle, water, glycogen, or food in your digestive system. It fluctuates wildly based on factors having nothing to do with your actual body composition. And it tells you nothing about the most important thing—are you getting stronger, healthier, and more capable?
Body weight matters. But it's one piece of data among many. Relying solely on the scale is like trying to understand a book by reading only one page. You need multiple metrics to see the complete picture of your progress.
Let's break down why the scale lies, what causes daily weight fluctuations, better metrics to track progress, how to measure body composition accurately, and building a comprehensive tracking system that shows real improvement even when the scale doesn't cooperate.
Why the Scale Lies
What body weight actually measures.
What the Scale Shows
Your total mass:
Fat mass
Muscle mass
Bone mass
Water weight (60% of bodyweight)
Glycogen stores (plus water bound to glycogen)
Food in digestive system
Waste waiting to be eliminated
The scale can't distinguish these.
Example scenario:
Lost 2 lbs fat
Gained 1 lb muscle
Retaining 2 lbs water (high sodium meal yesterday)
Scale shows: +1 lb
Reality: Excellent progress (lost fat, gained muscle)
Your interpretation: "I gained weight, I'm failing"
The scale tells you total mass, not body composition.
Daily Weight Fluctuations
Normal variation: 2-5 lbs daily
Causes:
Water retention: Sodium intake, hormones (menstrual cycle), stress/cortisol, carb intake (1g carb holds 3-4g water), training-induced inflammation
Glycogen storage: Low-carb day: depleted glycogen + water loss, High-carb day: replenished glycogen + water gain, 3-4 lb swing without fat change
Digestive system contents: Large meal: 2-3 lbs food/water in system, Takes 24-48 hours to fully digest, Shows as weight gain temporarily
Bowel movements: 1-2 lbs difference depending on timing
Hydration status: Well-hydrated: holding more water, Dehydrated: weighing less (bad thing), Not fat loss
You can "gain" 3-5 lbs overnight without gaining any fat.
When the Scale Actually Means Something
Long-term trends only:
Weekly average over 4-6 weeks
Not day-to-day changes
Not even week-to-week necessarily
Pattern over time
Example:
Week 1 average: 200 lbs
Week 2 average: 201 lbs (up 1 lb—might be water)
Week 3 average: 199 lbs (down 2 lbs—might be dehydration)
Week 4 average: 198 lbs (down 2 lbs from week 1—real trend)
Single weigh-ins are meaningless. Trends over weeks matter.
Better Metrics for Progress
What actually tells the story.
Strength and Performance
The most objective measure:
Are your lifts going up?
Can you do more reps with same weight?
Is your total training volume increasing?
Are you running faster/farther?
Why this matters:
Strength gains = muscle maintained or built
Performance improvement = fitness improving
Objective and measurable
Directly reflects training effectiveness
Recomposition example:
Scale: Same weight for 3 months
Strength: Squat +50 lbs, Bench +20 lbs, Deadlift +60 lbs
Reality: Lost fat, gained muscle, dramatically improved body composition
Scale missed entire transformation
Track your lifts religiously. This is progress.
Body Measurements
Tape measure doesn't lie (much):
Key measurements:
Waist (at belly button, relaxed)
Hips (widest point)
Chest (nipple line)
Thighs (mid-thigh)
Arms (flexed, largest point)
Calves (largest point)
Frequency: Every 2-4 weeks (not weekly—too variable)
What to look for:
Waist decreasing = losing fat
Chest/arms/thighs increasing = building muscle
Hip measurement relative to waist
Overall proportions changing
Example progress:
Scale: 180 lbs → 180 lbs (no change)
Waist: 36" → 33" (-3 inches)
Arms: 14" → 15" (+1 inch)
Chest: 40" → 42" (+2 inches)
Result: Clear fat loss and muscle gain, scale showed nothing
Progress Photos
Visual proof:
The protocol:
Same lighting (natural light best)
Same time of day (morning, consistent hydration state)
Same location
Same poses (front, side, back)
Same clothing (underwear or form-fitting)
Every 2-4 weeks
Why photos work:
See changes you don't notice daily
Show body composition, not just weight
Motivating when scale stalls
Visual proof of progress
What you'll see:
Definition increasing (muscle visibility)
Waistline shrinking
Shoulder width appearing greater (even if not bigger)
Overall shape changing
Posture improving
Side-by-side comparisons reveal progress the scale hides.
How Clothes Fit
The practical metric:
Pants looser in waist but tighter in thighs = fat loss, muscle gain
Shirts tighter in shoulders/chest = muscle growth
Belt notches = objective measurement
Old clothes fitting again
This is what actually matters in real life.
People don't compliment your scale weight. They notice how you look and carry yourself.
How You Feel and Function
Subjective but important:
Energy levels:
More energy throughout day
Less afternoon crashes
Better workout performance
Waking up easier
Physical capabilities:
Stairs easier
Carrying groceries easier
Playing with kids easier
Daily activities require less effort
Recovery:
Less sore between workouts
Sleeping better
Recovering faster
Able to train more frequently
Mood and confidence:
Better body image
More confident
Improved mental health
Feeling stronger and more capable
These "soft" metrics matter enormously for quality of life.
Body Composition Testing
Measuring fat vs. muscle more directly.
DEXA Scan (Gold Standard)
What it is:
X-ray based scan
Measures bone density, fat mass, lean mass
Most accurate available
Pros:
Very accurate
Shows regional distribution
Clear fat/muscle breakdown
Objective data
Cons:
Expensive ($100-200 per scan)
Not widely available
Only needed occasionally
Frequency: Every 3-6 months if using
Bioelectrical Impedance (Scales/Handheld)
What it is:
Electrical current through body
Estimates based on resistance
Home scales or gym devices
Pros:
Cheap and accessible
Convenient
Tracks trends
Cons:
Wildly inaccurate in absolute terms
Affected by hydration massively
Can be off by 5-10% body fat
Only useful for trends, not actual numbers
Use if you have it, but don't trust the numbers. Only watch trends.
Skinfold Calipers
What it is:
Pinching skin/fat at specific sites
Measuring thickness
Calculating body fat percentage
Pros:
Cheap ($10-30)
Can do at home
Reasonable accuracy if done consistently
Cons:
Requires skill/practice
Same person should measure
Can be inaccurate if technique varies
Awkward for some sites
Useful for tracking changes, not absolute accuracy.
Visual Assessment and Mirror
Simplest method:
Look in mirror objectively
Compare to photos
Notice definition, vascularity, muscle separation
Muscle visibility indicators:
Shoulder striations
Quad separation
Visible abs (different levels)
Arm vascularity
Overall definition
More defined = lower body fat, regardless of scale.
Building a Comprehensive Tracking System
Using multiple metrics together.
The Weekly Routine
Monday morning (same conditions every week):
Weigh in (after bathroom, before eating/drinking)
Take measurements (if week for this)
Take progress photos (if week for this)
Record in tracking system
Throughout week:
Log all workouts (weight, reps, sets)
Note energy levels and how you feel
Track clothing fit changes
Record subjective metrics
End of week:
Review all data together
Look for trends across metrics
Adjust plan if needed
What Good Progress Looks Like
When scale doesn't move but you're winning:
Strength increasing consistently
Measurements improving (waist down, muscles up)
Photos showing visual changes
Clothes fitting better
Feeling stronger and more energetic
Recovering well between sessions
This is successful body recomposition.
If multiple metrics trending positively, ignore stubborn scale.
When to Actually Worry
Red flags across multiple metrics:
Strength decreasing for 2+ weeks
All measurements increasing
Photos showing worse condition
Clothes fitting tighter everywhere
Energy terrible
Recovery poor
This indicates real problem (overtraining, inadequate nutrition, illness, etc.)
But if scale up while other metrics good: not a problem.
Hydration and Weight Fluctuations
How water affects the scale.
Proper Hydration Causes "Weight Gain"
The paradox:
Adequate hydration = holding appropriate water
Shows as higher scale weight
Actually healthy and necessary
Supports performance and recovery
Dehydration shows as "weight loss":
Step on scale dehydrated: weighing less
Feel accomplished
Actually impaired performance
Terrible for health and results
Well-hydrated with Grip Hydra:
May weigh 2-4 lbs more than dehydrated
This is good
Supports training and recovery
Muscle arm reminder: proper weight includes proper hydration
Consistent Hydration = Consistent Weigh-Ins
For accurate tracking:
Same hydration state each weigh-in
Morning after bathroom, before drinking
Hydrate consistently day to day
Reduces noise in data
Inconsistent hydration = erratic scale readings.
The Mental Game
Changing your relationship with the scale.
Detach Emotionally
The scale is data:
Not judgment
Not success or failure
Just one metric
Combine with others
Your worth ≠ scale number.
Focus on What You Can Control
Controllable:
Training consistency
Nutrition adherence
Sleep quality
Hydration (with Grip Hydra)
Effort in gym
Recovery practices
Not controllable:
Daily weight fluctuations
Water retention
Hormonal cycles
Short-term scale changes
Control your actions. Let metrics follow.
Celebrate Non-Scale Victories
Real wins:
PR on squat
Pants size down
Compliment on appearance
More energy
Better sleep
Stairs easier
Feeling strong
These matter more than number on scale.
The Bottom Line: Multiple Metrics Tell the Truth
The scale is a tool, not the truth. Body weight is one data point among many. Progress is a multidimensional process that a single number cannot capture.
Track:
Scale weight (weekly averages, not daily obsession)
Strength and performance (primary metric)
Body measurements (every 2-4 weeks)
Progress photos (every 2-4 weeks)
How clothes fit (ongoing)
Energy and recovery (daily awareness)
How you feel (quality of life)
The complete picture:
When multiple metrics trending positively = progressing
When scale stalls but everything else improves = still winning
When all metrics declining = time to adjust
Stop letting one number on one device determine your success. Start looking at the full picture of your progress.
Your Comprehensive Tracking Plan
Starting this week:
Start training log (weight, sets, reps every session)
Weekly weigh-ins (same conditions, track average)
Measurements (every 2 weeks)
Progress photos (every 2-4 weeks)
Note how you feel (energy, recovery, confidence)
Track clothing fit (belt notches, how pants feel)
Stay hydrated with Grip Hydra (consistent hydration = consistent data)
Within 4-8 weeks of comprehensive tracking:
See progress scale doesn't show
Less obsession with daily weight
More focus on what matters
Clear evidence of improvement
Motivation from multiple victories
The scale is one tool. Use them all. See the full picture of your progress.
[Grip Hydra: Consistent Hydration for Consistent Progress Tracking →]

